
In mergers and acquisitions, price hinges not on what a company earned last year but on what it will earn next year under new ownership. That distinction — between reported EBITDA and sustainable EBITDA — sits at the center of every serious transaction, and understanding how buyers actually test for it is essential for anyone in transaction advisory, deal origination, or financial due diligence.
When a buyer opens an information memorandum showing several million dollars of EBITDA, the first question is never whether that figure is technically accurate under accounting standards. The real question is whether that earnings level will persist after closing, without the current owner's involvement, under normal market conditions, and under the capital structure the buyer intends to use.
Why Reported EBITDA Is Never the Real Starting Point
Reported EBITDA is, by construction, an accounting artifact — shaped by judgment calls, timing effects, ownership structure, and one-off events, none of which a Quality of Earnings (QoE) review tries to “correct” in the way an audit would. Instead, it normalizes the number for economic sustainability. Owner-specific distortions are one common driver of the gap: a founder paying themselves well above market replacement cost inflates expenses and understates reported EBITDA, while an owner who underpays themselves does the opposite (Synergy AI, 2025; Windsor Drake, 2026). One-time events — legal settlements, restructuring costs, disaster losses, sale-related transaction fees — depress reported earnings without reflecting ongoing performance and are typically added back once genuinely non-recurring (Anders CPA, 2026; Transaction Services Training, 2026).
Timing effects and accounting choices around revenue recognition and accruals shift earnings between periods without changing underlying economics (Grant Thornton, 2026), and run-rate changes — a mid-year price increase or a completed headcount reduction — simply have not shown up in a full year's numbers yet.
The resulting gap is far from trivial. In lower middle-market transactions, the median difference between reported and adjusted EBITDA has been measured at roughly 35%, with add-backs commonly accounting for close to 29% of the adjusted figure (Synergy AI, 2025; Lippes, n.d.). That gap is exactly why the reported-to-adjusted EBITDA bridge becomes the single most scrutinized, most negotiated line in a deal — at a 7x multiple, every dollar of accepted add-back adds seven dollars of enterprise value, and every dollar rejected removes the same (OpsFi, 2026).
Three Tests Every Earnings Component Must Pass
A QoE review works through each component of reported EBITDA and holds it against three tests: sustainability, repeatability, and transferability (Shape Executive, n.d.-b). Sustainability asks whether an earnings component will persist at the same level under new ownership and near-term market conditions, or whether it depends on something temporary — favorable commodity pricing, a short-lived regulatory benefit, a one-off customer project (Shape Executive, n.d.-b; Forvis Mazars, 2024).
Repeatability asks whether the performance reflects a genuinely replicable commercial process or a one-off event that happened to inflate a single period (Grant Thornton, 2026; Shape Executive, n.d.-b). Transferability asks whether the earnings depend on people, relationships, or practices that will not transfer with the business — a question that becomes especially pointed in founder-led companies where revenue generation is tightly bound to the owner's personal involvement (Shape Executive, n.d.-b). Two businesses can report identical EBITDA and be worth very different amounts once these three questions are answered honestly.
The Four Categories of EBITDA Add-Backs
Every line on an EBITDA bridge falls into one of four buckets, and knowing which bucket an item belongs in tells a buyer exactly what evidence to demand (OpsFi, 2026).
- One-off (non-recurring) add-backs — costs genuinely unlikely to recur, such as a legal settlement, a flood, or one-time restructuring severance. The test is whether it is truly isolated; a “one-off” settlement appearing in three of the last four years is a recurring cost of doing business, not an add-back (OpsFi, 2026).
- Run-rate adjustments — annualizing a change that occurred part-way through the period, such as a price increase in month nine or a facility opened in Q3. These are legitimate when the triggering event is documented and become fiction when they annualize a benefit while quietly ignoring the offsetting cost (OpsFi, 2026; Synergy AI, 2025).
- Pro forma adjustments — known, measurable future changes, such as a signed contract not yet billing. The standard is “known and measurable,” not “hoped for”; an add-back for expected synergies or a sales pipeline belongs in the financial model, not the historical bridge (OpsFi, 2026).
- Owner and discretionary add-backs — personal expenses run through the company, above-market owner salary, or family members on payroll. Legitimate only to the extent of normalizing to a genuine market-rate replacement cost, not simply removing the expense entirely (OpsFi, 2026; Windsor Drake, 2026).
Strip away the category labels and every legitimate adjustment clears the same three hurdles: it is real, meaning it actually hit the P&L and traces to a specific transaction rather than management's assertion; it is genuinely non-recurring or properly normalizing, with both sides of the adjustment reflected rather than just the favorable one; and it is documented, supported by an invoice, contract, or payroll record rather than a verbal claim (OpsFi, 2026; Windsor Drake, 2026).
Anything that cannot be traced to source evidence gets reversed — and that reversal comes directly out of the negotiated price (Add-back, 2026).
Legitimate vs. Questionable Add-Backs
The same line item can be a fair normalization or a price grab, depending entirely on the evidence behind it:
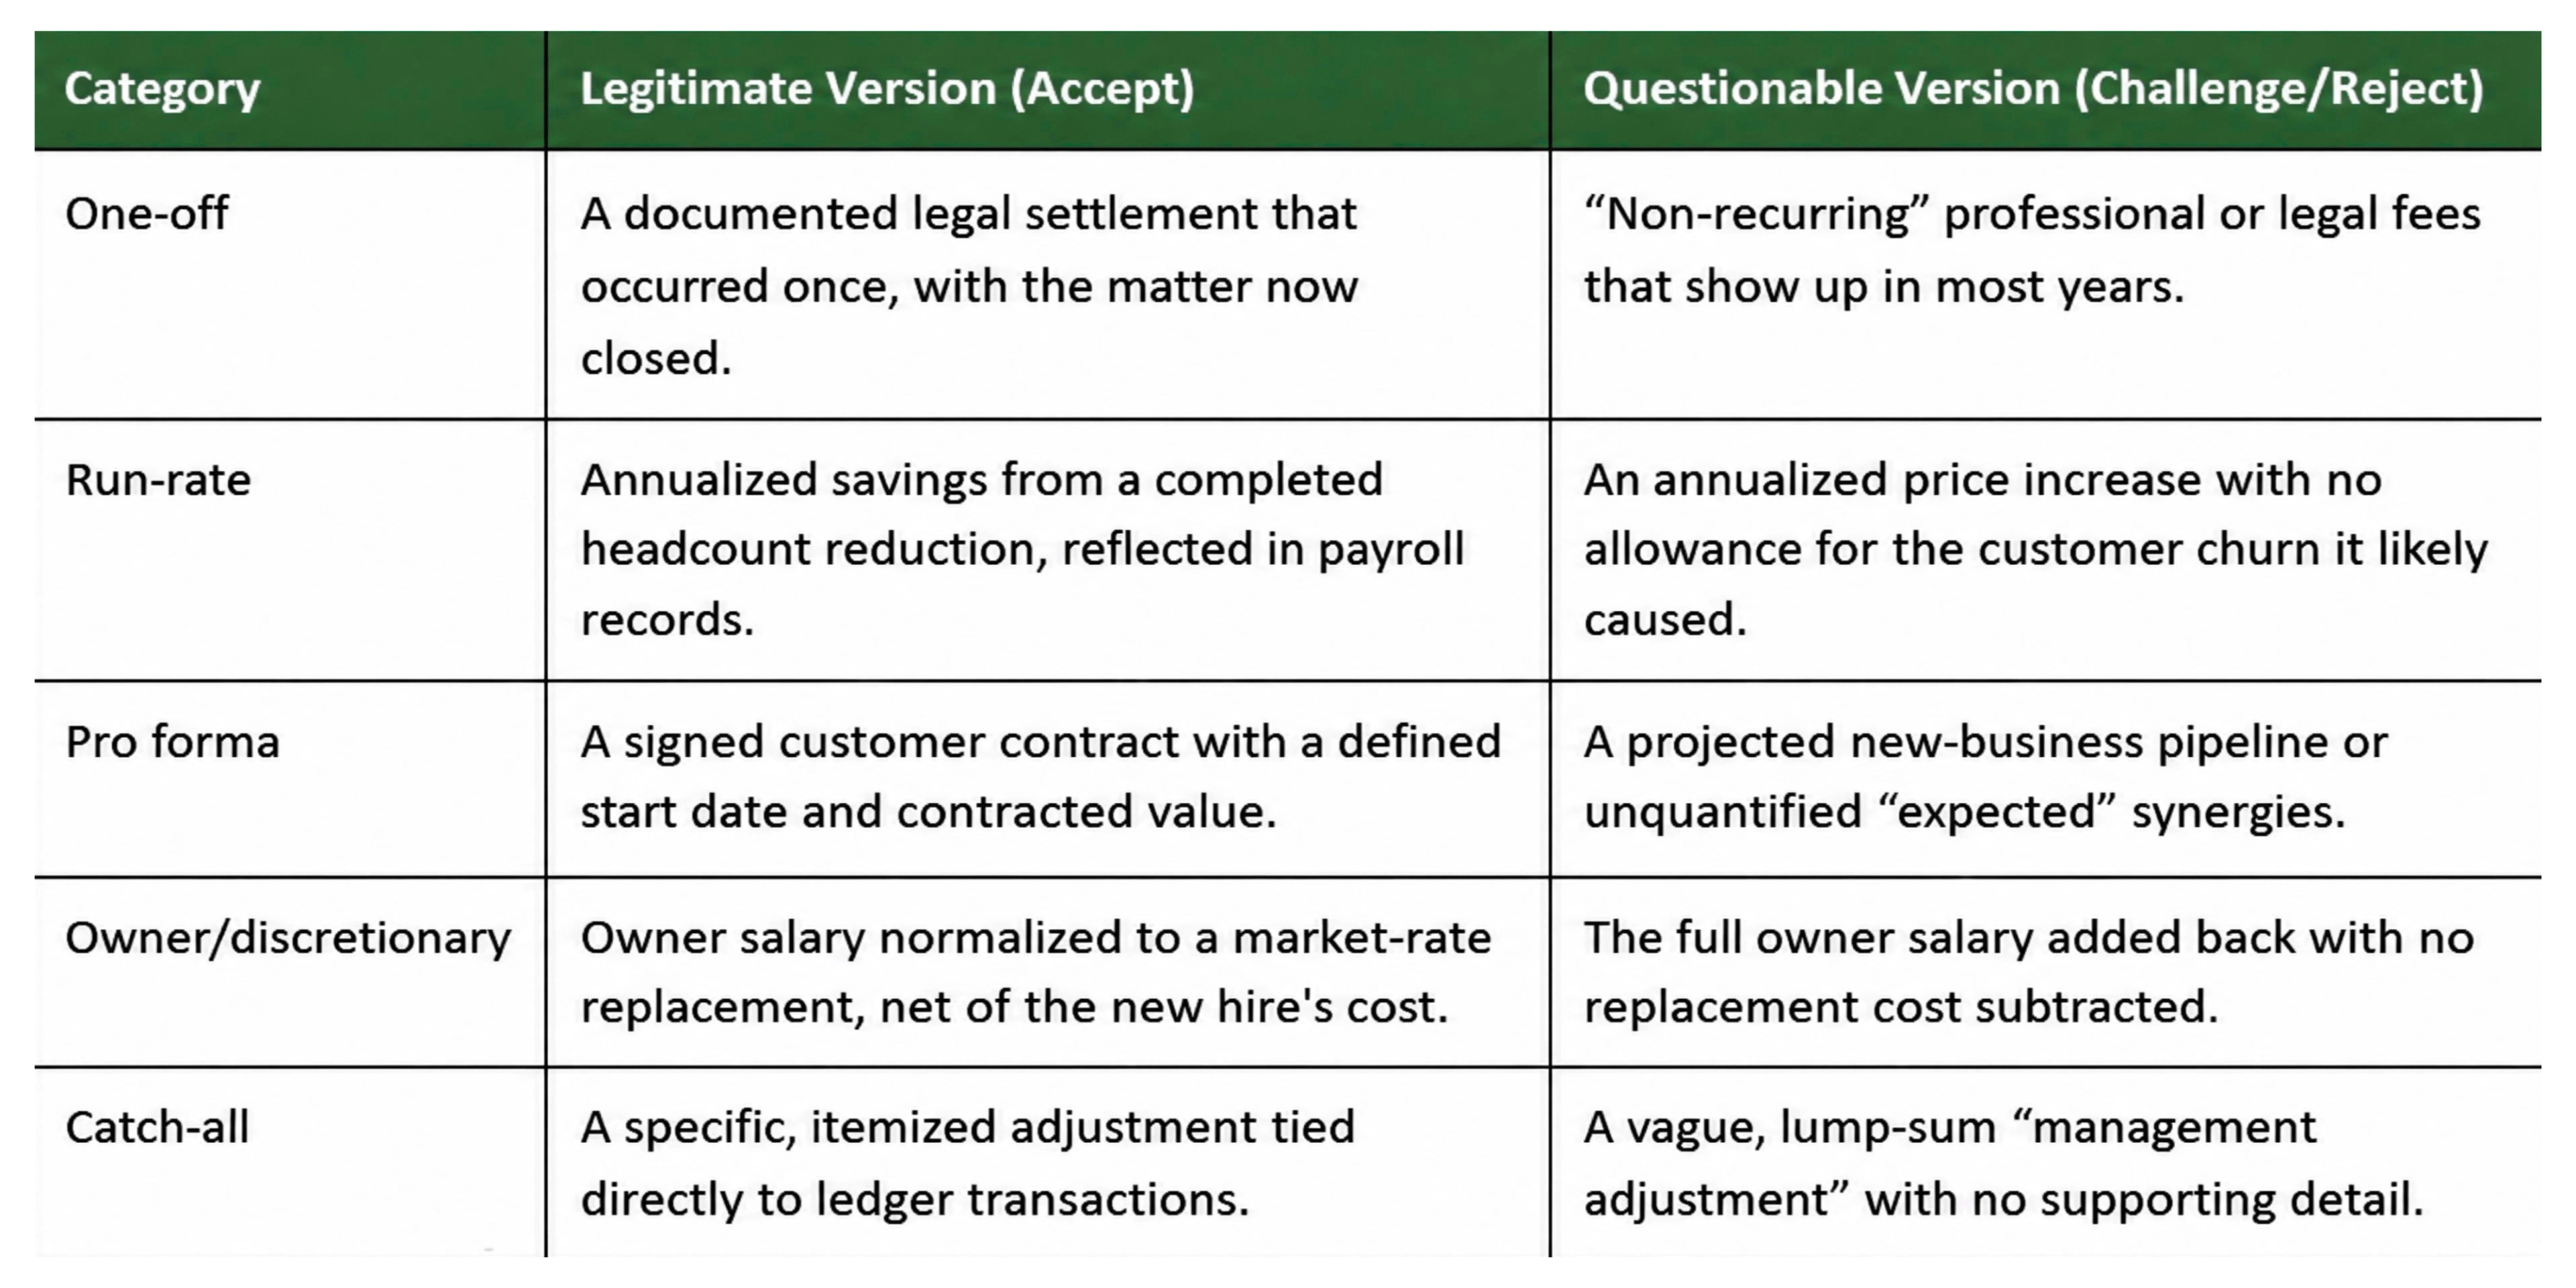
Each of the four categories carries a materially different burden of proof, and treating them interchangeably — a common mistake among less experienced reviewers — is how weak adjustments slip through (OpsFi, 2026).
Red Flags That Trigger Deeper Scrutiny
Patterns matter more than any single line item. A round-number “management adjustment” with no itemization is one of the clearest signals of trouble, since legitimate add-backs are specific and traceable while inflated ones tend to hide in aggregates (OpsFi, 2026; Windsor Drake, 2026).
One-sided adjustments — add-backs that only ever run favorably, with no offsetting subtraction for items that cut the other way — deserve the same suspicion, as does the same cost being reclassified as “non-recurring” across multiple consecutive years (OpsFi, 2026; Add-back, 2026).
High adjusted EBITDA paired with weak cash conversion is a particularly telling combination, since earnings quality can never really be assessed in isolation from cash (Shape Executive, n.d.-b; OpsFi, 2026). And magnitude itself is informative: an adjusted EBITDA that runs 15–25% above reported is broadly normal for a mid-market deal, while an uplift above roughly 40% signals either an unusually messy accounting environment or an unusually aggressive seller — either way, a reason for deeper diligence (Synergy AI, 2026).
Beyond the Bridge: Eight Dimensions of Earnings Quality
Buyers also assess earnings quality across dimensions that sit outside the add-back schedule itself (Shape Executive, n.d.-b):
- Revenue quality — whether revenue is recurring versus transactional and contracted versus discretionary; weaknesses here are rarely fixable through cost normalization further down the analysis (Grant Thornton, 2026; Shape Executive, n.d.-b).
- Customer concentration — when a small number of relationships represent the majority of revenue, buyers discount both the multiple and the terms, especially where those relationships are founder-dependent (Shape Executive, n.d.-b).
- Margin quality — whether gross margin is consistent, systematically managed, and pricing-driven, rather than resting on a single supplier relationship or informal, undocumented pricing decisions (Shape Executive, n.d.-b).
- Working capital quality — whether EBITDA actually converts to cash at the rate the model implies, an especially material question in cash-free, debt-free deal structures (Grant Thornton, 2026; Shape Executive, n.d.-b).
- Forecast reliability — how closely historical forecasts matched actual results, which speaks directly to management's commercial and operational visibility (Shape Executive, n.d.-b).
- One-off earnings — revenue events, insurance recoveries, or temporary cost savings that are not part of the run-rate business and must be stripped out before applying a multiple (Shape Executive, n.d.-b).
- Management reporting quality — the speed and granularity of monthly reporting is itself treated as a signal of operational maturity (Shape Executive, n.d.-b).
- Exogenous factors — commodity prices, weather, supply-chain conditions, and inflation can all inflate or depress results temporarily; buyers test whether reported performance reflects a tailwind unlikely to persist (Forvis Mazars, 2024).
Inflation deserves particular attention here: rising input costs can create temporary margin expansion through inventory-costing effects — a business selling through lower-cost inventory at newly raised prices shows a margin bump that compresses again once higher-cost inventory works through the system — which is exactly the kind of accounting-driven, non-operational swing a QoE is designed to catch (Forvis Mazars, 2024).
Reading an EBITDA Bridge
The EBITDA bridge — sometimes called the EBITDA waterfall — is the standard format for walking from reported net income to adjusted EBITDA. In a representative illustration, reported net income moves up through interest, taxes, and depreciation and amortization to reported EBITDA; from there, owner-compensation normalization, personal expenses run through the business, a one-time legal settlement, and non-recurring consulting costs are added back, while a below-market replacement salary is subtracted, arriving at an adjusted EBITDA meaningfully above the reported figure — in one such example, a roughly 33% uplift that, at a 6x multiple, moves enterprise value by several million dollars (Synergy AI, 2025).
A reconciliation built this way turns normalization logic into something a buyer's finance team can trace line by line rather than a story taken on faith; the two most common presentation errors are stacking add-backs without offsetting subtractions, and quietly rounding each line until the total overstates the real number (Add-back, 2026).
An add-back a buyer rejects does not simply disappear — it propagates. Removing a modest amount of unsupported adjustments from the bridge can mechanically remove several times that amount from enterprise value at a typical multiple, before any further negotiation even begins (OpsFi, 2026).
The same rejection also lowers the EBITDA base that lenders size leverage and covenants against, which is one reason earnings-quality scrutiny has become just as central to private credit underwriting as it is to equity buyers, particularly as the US private credit market has scaled dramatically in recent years (OpsFi, 2026).
How QoE Teams Actually Test the Numbers
A buyer's QoE provider verifies each adjustment through a consistent process: tracing every add-back to individual general-ledger transactions rather than trusting a management schedule (Add-back, 2026); testing whether claimed one-time costs actually recur when the review window is extended beyond what the seller presented; benchmarking owner compensation and related-party arrangements against third-party salary surveys and market comparables (Synergy AI, 2025; Add-back, 2026); running working capital normalization as a distinct exercise from EBITDA normalization, since one sets the cash target at close and the other sets the earnings base for the multiple (Add-back, 2026); and, in many engagements, a proof of cash that confirms reported revenues and expenses are actually supported by bank activity rather than existing only as accounting entries (Grant Thornton, 2026; Anders CPA, 2026).
AI-native testing has meaningfully changed the economics of this process. Where sampling was once necessary simply because manually tracing every transaction across years of ledger data took weeks, tooling can now reconcile thousands of ledger lines, invoices, and contracts in minutes — which means a recurring “one-time” cost is far more likely to surface, because the system checked every instance of it rather than a sample that happened to catch one (OpsFi, 2026; Add-back, 2026).
What this technology does not replace is judgment: whether a relabeled cost is genuinely non-recurring, whether an owner-salary normalization is honest, whether a run-rate adjustment quietly drops an offsetting cost — these remain calls for an experienced reviewer, with the tooling widening what can be checked rather than deciding anything on its own (OpsFi, 2026).
Preparing for the Scrutiny: Sellers and Buyers
For sellers, the practical response starts well before a deal process begins. Every adjustment needs supporting evidence — contracts, invoices, salary surveys — built into a running schedule from the first day of preparation rather than reconstructed under deadline pressure (Synergy AI, 2025; Add-back, 2026).
A sell-side QoE, while a real expense, can protect a disproportionate amount of enterprise value by surfacing issues before a buyer does; the practice is now standard among PE-backed sellers and increasingly common among founder-led businesses as well (OpsFi, 2026; Synergy AI, 2025).
Presenting only adjustments confident enough to survive scrutiny — rather than every conceivable add-back — tends to build more credibility than it costs in headline EBITDA (Synergy AI, 2025), and starting the underlying operational work well over a year ahead of a sale, rather than in the final months, is what actually produces three years of evidence that earnings are sustainable, repeatable, and transferable (Shape Executive, n.d.-b).
For buyers, the discipline is symmetrical: treat the seller's adjusted EBITDA as a starting hypothesis rather than a number to anchor on immediately, keep the reported, seller-adjusted, and buyer's own view of EBITDA visible side by side, and build an independent bridge that accepts, partially accepts, or rejects each add-back with its dollar and multiple impact made explicit (Mowery & Schoenfeld, 2026; OpsFi, 2026).
Every add-back should be held to the same three-part test — real, non-recurring, documented — with particular attention to the magnitude of total adjustments relative to reported EBITDA and a direct cross-check against actual cash flow, since earnings that grow on paper without a corresponding increase in cash generation are a warning sign in their own right (Synergy AI, 2026; Mowery & Schoenfeld, 2026).
Why This Matters Beyond the Deal Itself
For M&A advisors and corporate development professionals, this is not a peripheral technical skill — it is core to effective advisory practice. A well-executed QoE establishes a credible, defensible earnings baseline, surfaces non-recurring items and timing effects early, and materially reduces the risk of post-closing disputes (Grant Thornton, 2026).
It also shapes negotiation directly: buyers lean on challenged adjustments to push back on price, sellers lean on accepted add-backs to justify valuation, and the gap between management's figure and the adviser's figure is almost always the central discussion point (Synergy AI, 2025; Transaction Services Training, 2026). Industry research has attributed a large share of M&A failures to overpaying and inadequate due diligence — two failure modes that meet precisely at an unexamined add-back schedule (OpsFi, 2026).
Quality of Earnings was never about maximizing EBITDA — it is about understanding, with real evidence, what portion of earnings is durable, repeatable, and backed by actual cash generation. A buyer does not pay for what a business earned last year; they pay for what it will credibly earn next year, and the year after, under their ownership, and a well-built QoE is the evidence base for that judgment (Shape Executive, n.d.-b).
For sellers, the window to improve earnings quality is measured in years, not the final months before a sale, since sustainable EBITDA, reliable cash conversion, and consistent margins are the product of operational systems, not a transaction-preparation exercise (Shape Executive, n.d.-b). For buyers, an adjusted-EBITDA schedule is always an argument rather than a fact — and the narrative that actually survives diligence, evidence intact, is the only version of the number that was ever worth paying for.
References
Addback. (2026, August 28). Avoid M&A repricing: EBITDA normalization backed by source evidence.
Anders CPA. (2026, August 5). Quality of earnings (QoE) report: What it is (and why it matters).
Forvis Mazars. (2024, February 5). Understanding sustainability of profits in M&A transactions.
Grant Thornton. (2026, April 16). Understanding quality of earnings.
Lippes. (n.d.). EBITDA addbacks in M&A: What buyers need to know before closing.
Mowery & Schoenfeld. (2026, April 2). EBITDA adjustments explained.
OpsFi. (2026, April 6). EBITDA add-backs: Real vs inflated adjustments.
Shape Executive. (n.d.-a). Exit readiness and EBITDA valuat